Latency profiling
End-to-end traces across APIs, workers, and data stores to isolate p95 regressions before they reach customers.
Craft-led application performance work for teams that need latency, throughput, and stability measured—not guessed.
We take scoped programming consulting engagements: profiling hot paths, tightening database access, and validating fixes against production-like load before you ship.

Every engagement starts with reproducible traces: which endpoints stall, which queries fan out, and which allocations spike under concurrency. We document those findings in plain language so your engineers can review the evidence.
Refactors stay small and reversible. We prefer incremental patches—index hints, batching, cache boundaries—over wholesale rewrites unless the profile proves it necessary.
Advisory sessions complement project scopes when you need a second pair of eyes on architecture decisions that will affect tail latency for years.

Performance is a practice: measure, change one variable, measure again—until the graph flatlines where your users notice.
End-to-end traces across APIs, workers, and data stores to isolate p95 regressions before they reach customers.
Connection pooling, batching, and back-pressure design reviewed against realistic concurrency—not laptop benchmarks.
Checklists for load tests, rollback plans, and observability gaps so performance fixes do not trade away reliability.
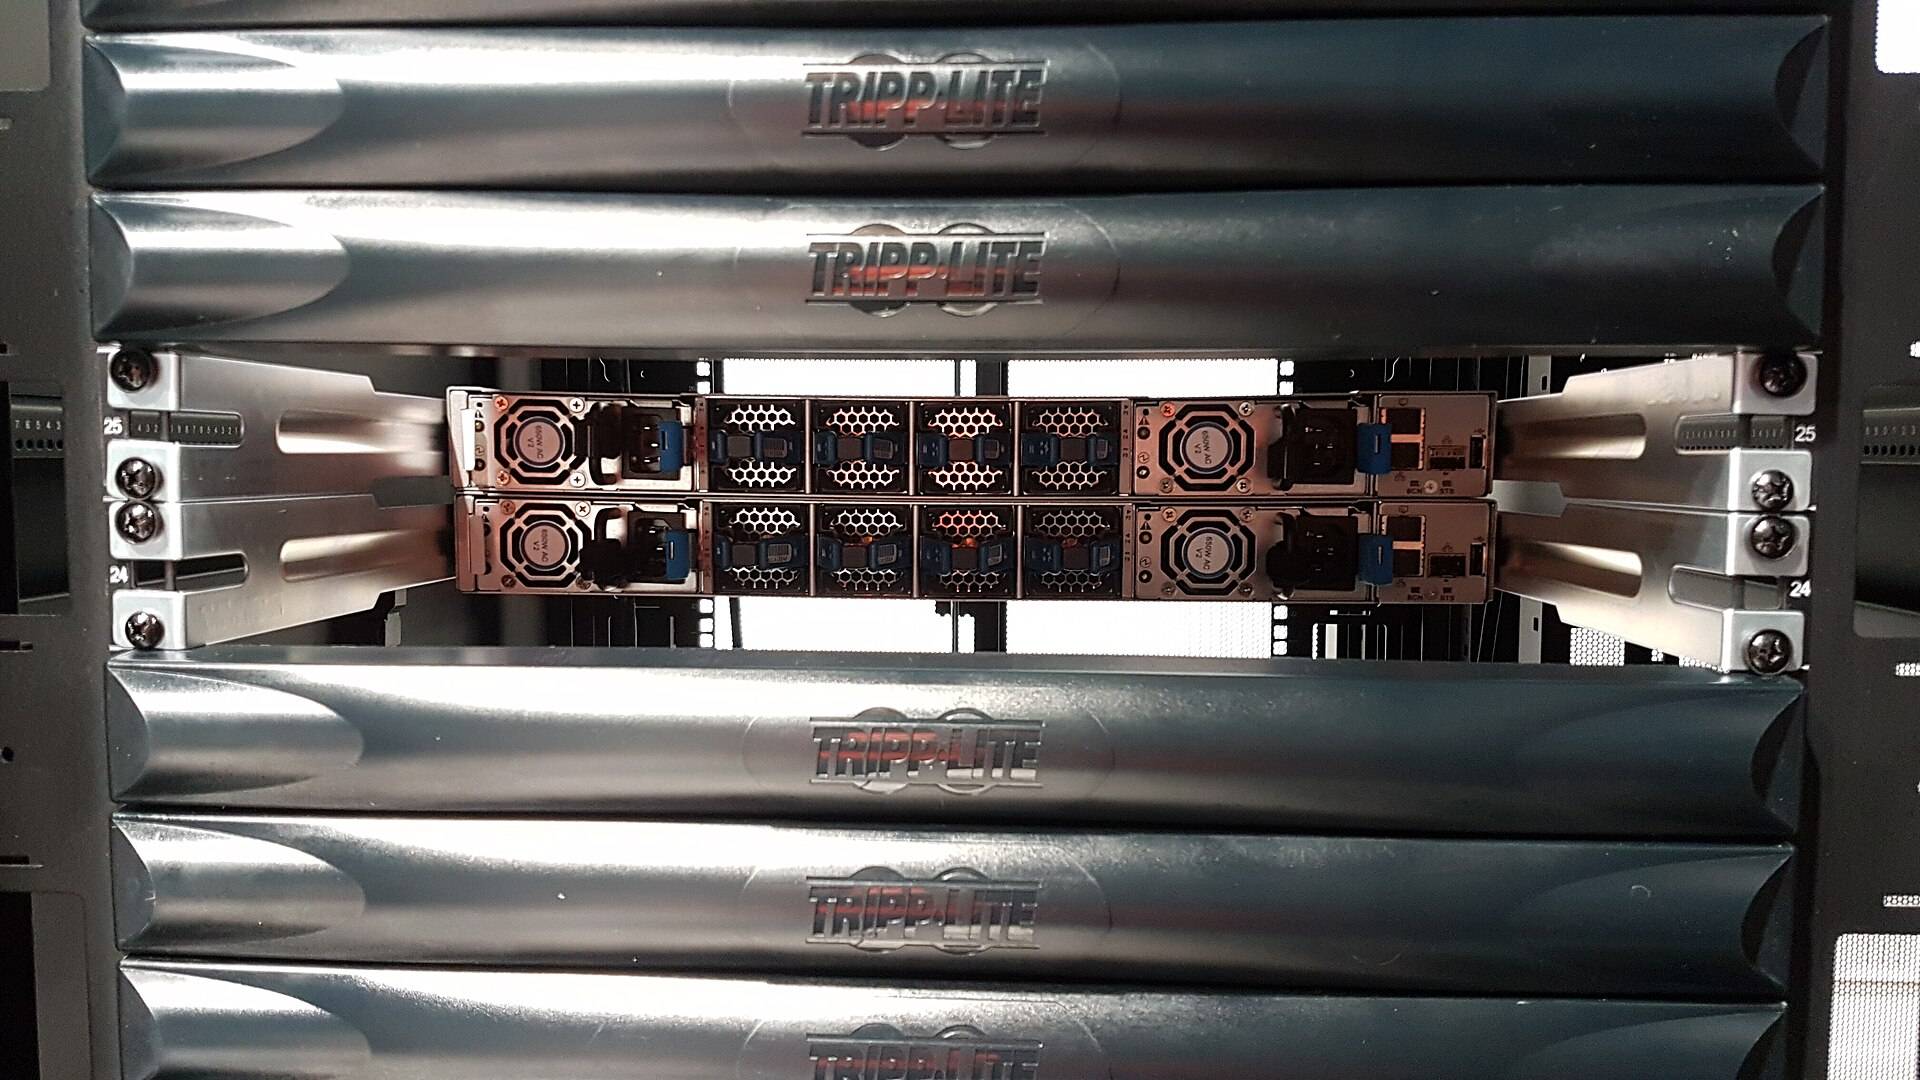
Application speed often traces to racks, switches, and how services share hardware. We read both code and deployment topology when scoping optimization work.
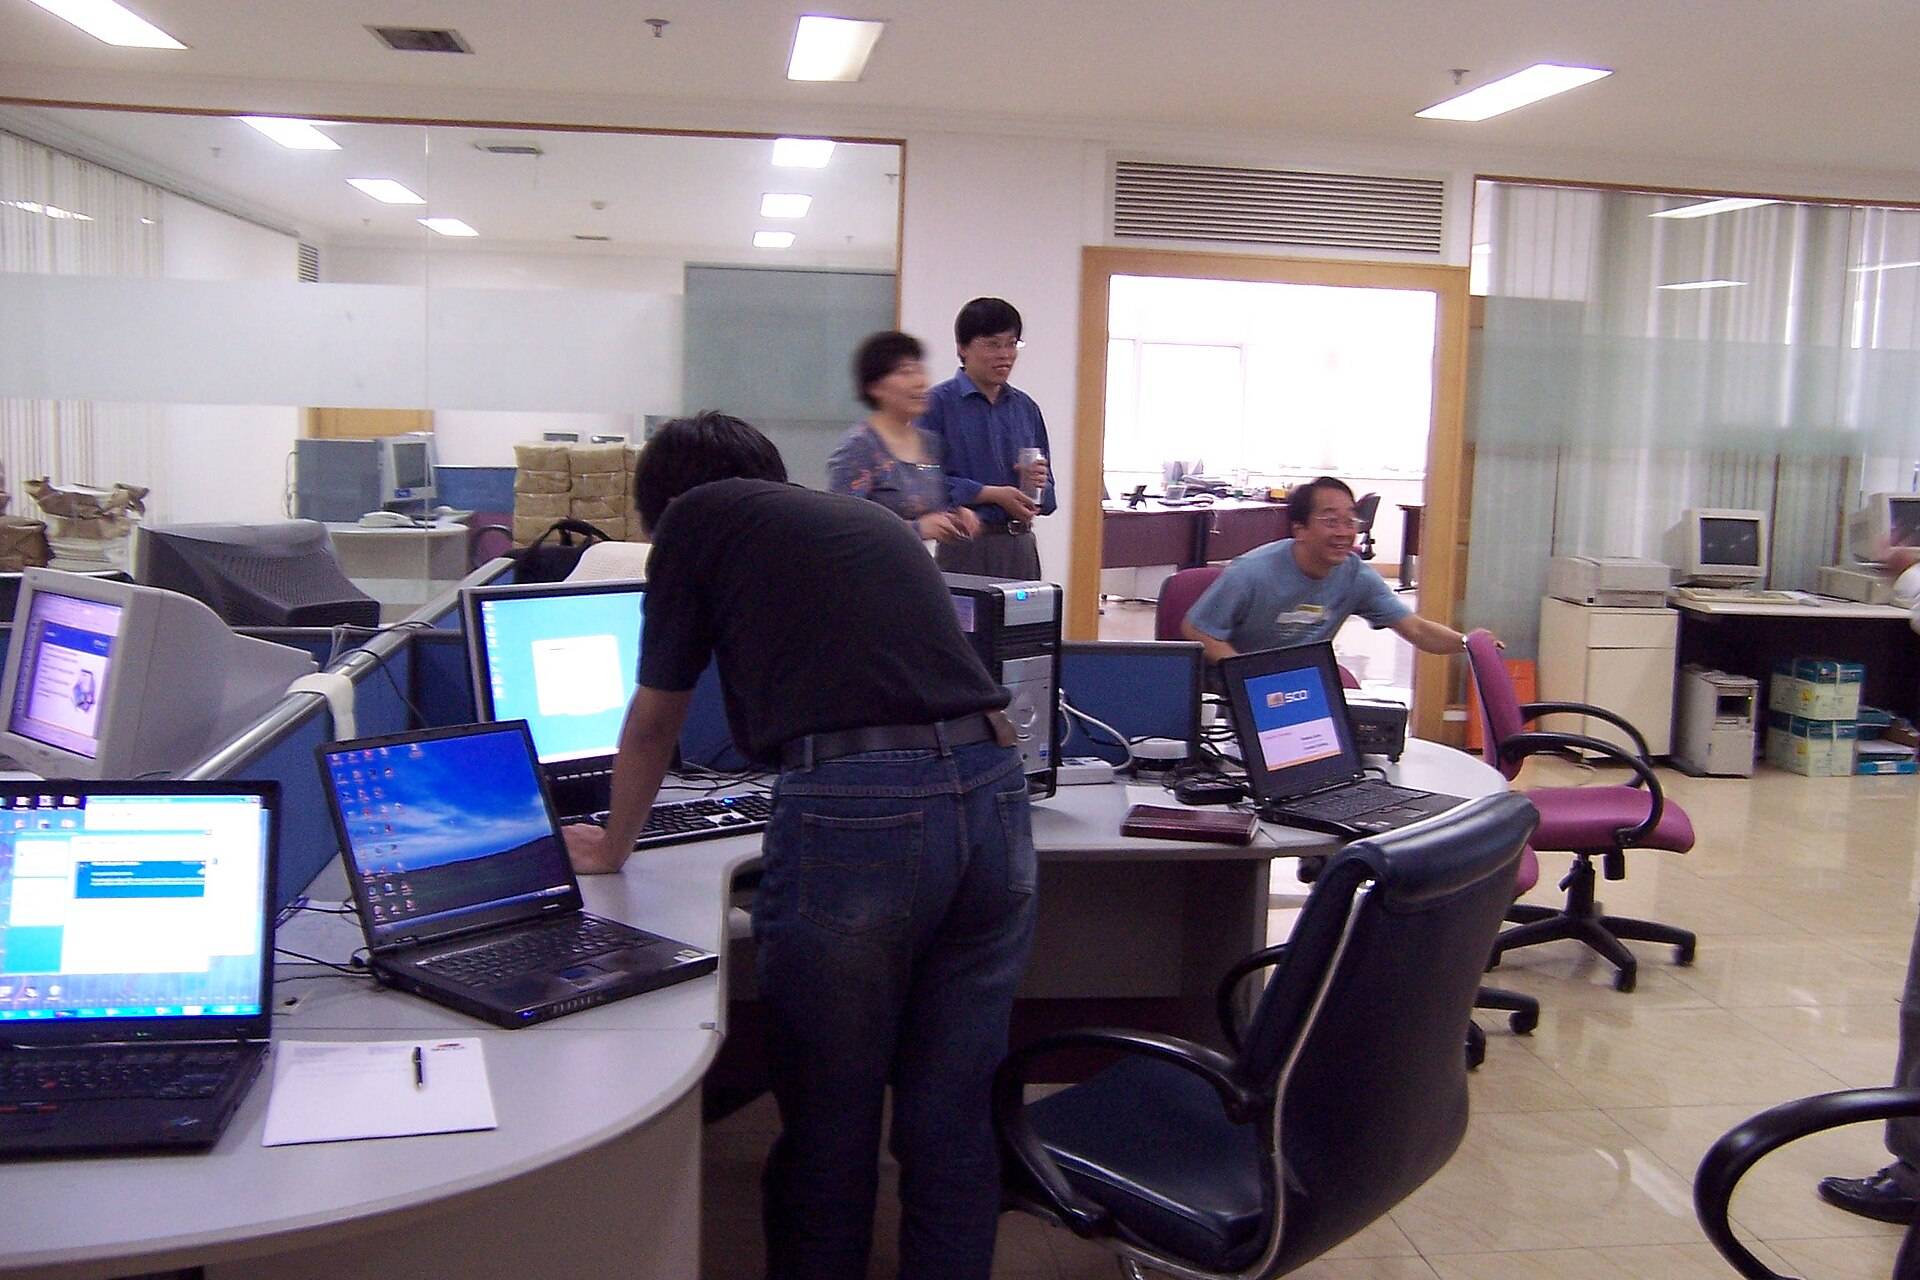
Product teams shipping services where milliseconds matter: checkout flows, realtime dashboards, or internal tools used by hundreds of concurrent staff.
Not a fit if you need a generic body shop or guaranteed ranking outcomes—we sell careful engineering time, not promises we cannot verify.